


Event research - Japan's MOF FX Market Interventions

The Ministry of Finance (MOF) in Japan intervened several times in the FX market throughout 2022-2024. In this article, we will offer a deep dive into our internal research, back tests and trading processes for the interventions. While the odds for further interventions have diminished, we nevertheless think this is an interesting piece to share.
Executive summary
This article reveals the curtain on how Japan’s MOF conducted FX interventions, how one recognizes an intervention and how one can avoid the main pitfalls when trading the interventions.
We also outline how the Thales team traded the intervention in the past, and we provide a full code and back test for the trading strategy explained in the article
The strategy yielded an annualized return of 5.25% and an Information Ratio of 1.22[1]
You may download the notebook at the end of the article
[1] Information Ratio = AnnualizedReturns(%)/Std.Dev.(Returns)
What is an intervention?
Under normal circumstances, markets are free to determine whatever price they see fit for a currency. Sometimes, policymakers decide that the price of a currency is excessively overvalued (undervalued) and directly step into the market by buying or selling the local currency.
There are several approaches to conducting interventions in the FX market with the Japanese employing a method that is “go hard or home,” i.e. entering the market with significant volume to quickly shift the price. In contrast, the Swiss National Bank (SNB) employs a more subtle strategy known as "stealth interventions", gradually influencing the currency's value in the desired direction without drawing much attention. Although judging from the latest intervention the Japanese did become touch more strategic, we would argue that the Swiss approach is more effective in achieving long-term goals.
Predicting the intervention
It is not particularly wise to attempt to predict the intervention. We know a lot of traders who fell into this trap and took consistent losses “trading the intervention”, which ultimately never happened. Regardless, there was one noticeable pattern that coincided with two interventions (Sept 2022, April 2024).
1) USDJPY hitting a price level (e.g. 150, 160).
2) Unusually large daily move.
3) Price action “blown off top”.

Explaining fake intervention risk
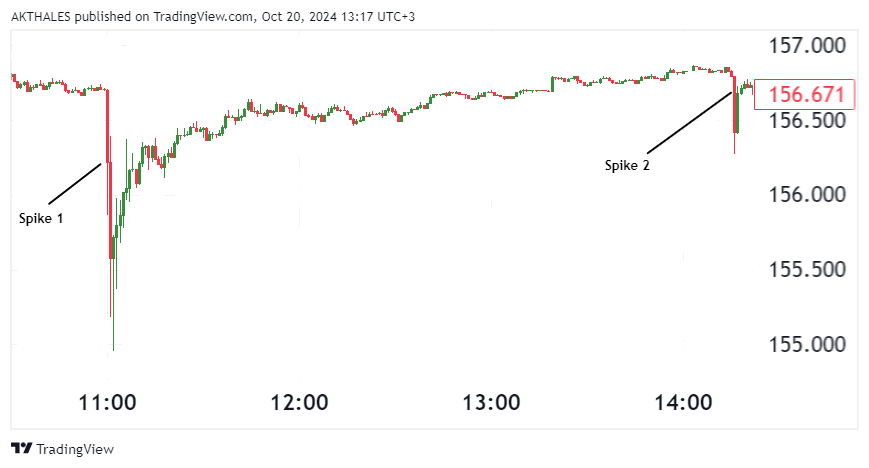
Before we talk about how we identify interventions, we need to examine “fake interventions” or “price spikes” that have happened in the Yen for the past 2 years. Our theory is that the spikes happen because there are trigger happy traders trying to anticipate interventions. There have been hundreds of mini spikes since 2022.[2]
Importantly, since the carry trade [3]has been unwound in July 2024, there has been very little spikes in the Yen as there’s no reason to fear interventions.
We define the “spike” as an abrupt 1–3 minute move that can range from 30-250 pips.[4] They can be ruthless as you cannot expect your stops to hold when one happens. Having a process to avoid them is crucial.
The spike risk is something that you can evaluate beforehand. As a rule of thumb, when USDJPY is 200-300 pips below the most recent high, spikes tend to be less frequent and, if they do occur, are usually smaller. On the other hand, when the pair is making new highs, at price levels Japanese authorities have been vocal about (e.g. 150, 155, 160), the spikes get very frequent.
[2] Buying the spike could be a major source of alpha for high frequency traders, because they always mean revert and happen without an underlying reason. Often market offers these ubiquitous sources of alpha for a small period of time and then it disappears as market conditions shift.
[3] A carry trade is when investors borrow from a low yield currency to invest in a high yield currency. The idea is to profit from a significant interest rate differential which could cause appreciation in the high yield currency.
[4] The vast majority of the spikes have been in the range of 30-50 pips. There have been two above 200 pip fake interventions, both coinciding with break of major price level (at 150 and 152).
Distinguishing an intervention from a spike and different kinds of intervention
The MOF publishes intervention data 1 month after the actual intervention. So, you can only objectively confirm that an intervention has taken place for certain after 1 month. Many market commentators were pre-announcing interventions, when there was just a spike!
There are several different kinds of interventions, and the market impact of an intervention depends on the actual amounts the MOF spend on intervening in the markets alongside the prevailing liquidity at the time. The largest and longer-lasting interventions have been in the range of 30 – 40 bn USD, amounting to around a 450-500 point move in USDJPY, and the shorter ones were 5 – 20 bn USD, amounting to a smaller move of 250-300 points.
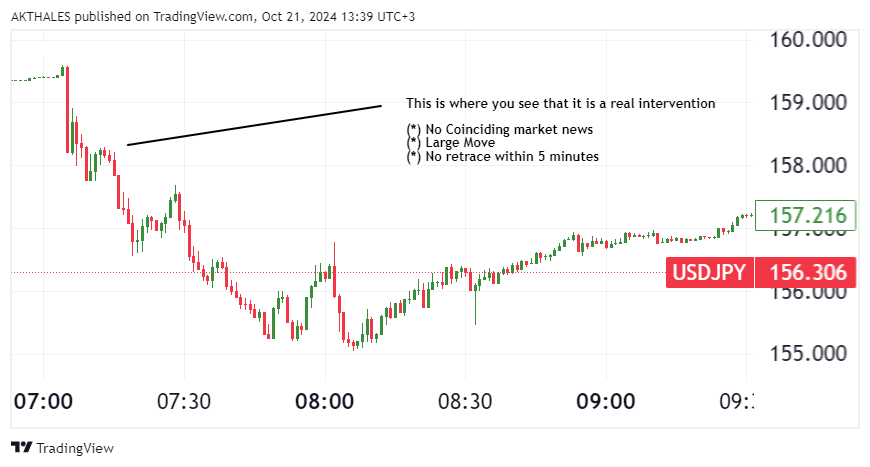
We have reproduced the charts of what an actual intervention looks like. The crucial element is that you can only know conclusively that is an intervention after 5 minutes, because the pair is making new lows on continued selling from the MOF. A spike will be retraced mostly or completely within 5 minutes, whereas in the case of an intervention, the rebound after the large initial move is more limited. Charts 3, 4 & 5 present the interventions carried out in 2024, and the ones in 2022 looked almost identical. The intervention size was later clarified to be in the range of 30 bn USD.

Since the May 1st intervention, the Japanese changed their approach. The latest intervention took place on July 11th, 2024, just after the release of the June U.S. inflation data, with lower size when the market was more vulnerable for a sell off after weak US CPI. This was arguably way smarter and more strategic than their previous stance.

Trading process
The important part to keep in mind is that an intervention can be defined only after 5 minutes. This removes the stress of “having to get into the market” immediately and makes it an extremely high probability winner. A simple trading process that we used to trade the intervention three out of the five times was
Enter after 5 minutes, after lower low
Use a time stop of 10 minutes with stops at break-even
Use incremental take profits of 200-300 points after 30 min – 1 hr[5]
Playing it with a time stop of 10 minutes instead of a fixed stop is better to prevent randomness in the price action. A stop of 10 minutes would be easily enough as the price would continue to go down if the MOF is still in the market.
It is also crucial to take profits from the intervention as the Yen always retraces the gains once the MOF is out of the market. Depending on your entry, a good take-profit is usually at 200-300 pips keeping in mind that the intervention lasts for roughly 30 min – 1hr.
Note that this strategy is designed to capture the big interventions. With this strategy, you would have not traded the latest intervention (we missed that one), but you would have captured the May 1st, 2024, in size (as we did).
In the future, if there are more interventions, we would anticipate that the BOJ goes for similar, more, tactical style as in the July intervention. At least that’s our recommendation to the MOF if we were to give out unsolicited advice! In any case, we don’t consider trading interventions, such the one in July, as high probability trading opportunities.
Parting words
Be mindful that an intervention has no impact on the fundamentals of the pair, it is designed to halt the sudden weakening, and it puts a floor on the currency. At the time of the second intervention in 2022 and the fifth intervention in 2024 the JPY weakness topped, but that was mainly because shifting perceptions about inflation and economic growth.
Stay tuned for more insights on our trading and proprietary research.
***
Strategy Performance Overview
Download our notebook to reproduce our MOF JPY Intervention trading strategy. Our research identifies patterns from past interventions to derive rules that are predictive of future interventions out-of-sample.[6] The code is designed to catch sizeable interventions and therefore would have not traded the small one in July 2024.
The back-testing of our strategy yielded an out-of-sample annualized return of 5.25% and an Information Ratio of 1.22. These performance metrics underscore the strategy's risk-reward effectiveness.

very interesting analysis, but the link can't be opened.